Singapore Air Quality Ranking: Global Position and Haze
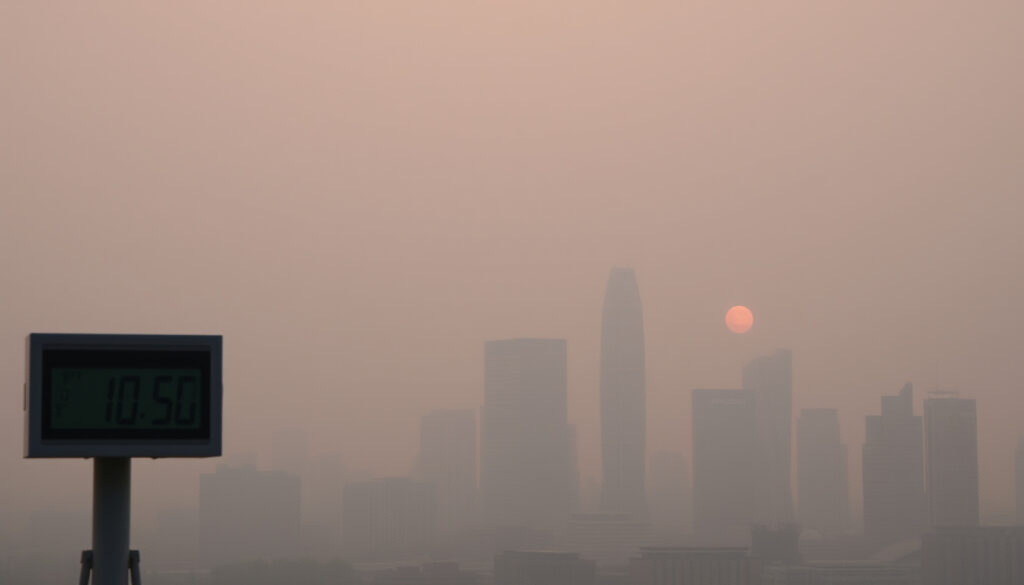
You check the air quality app before a morning run, and the number looks fine—moderate, green-ish. But then you step outside and the skyline is hazy, the smell of smoke faint in the air.
Singapore AQI range (2019): Good to Moderate · Central Singapore real-time AQI: 63 (Moderate) · 24-hour PSI (latest): 55–58 · Global ranking (IQAir 2023): 45th out of 131 countries
Quick snapshot
- Singapore uses the Pollutant Standards Index (PSI) as its official metric (National Environment Agency (NEA) FAQs)
- 100% of the population is exposed to PM2.5 levels above the WHO guideline (2024 World Air Quality Report)
- Transboundary haze from Indonesia is the primary cause of pollution spikes (NEA FAQs)
- Exact ranking for 2024 is not yet published by all indices
- Long-term health impact of moderate PM2.5 levels on Singapore’s population
- Exact contribution of local emissions versus transboundary sources to baseline PM2.5 levels
- 2019: AQI ranged Good to Moderate all year
- 2023: IQAir ranks Singapore 45th globally
- October 2023: Severe haze from Indonesian fires pushed PSI to unhealthy levels
- Haze season (June–October) approaching; transboundary haze risk remains
- NEA continues real-time monitoring via 20+ stations
| Metric | Value | Source |
|---|---|---|
| Population exposed to PM2.5 above WHO guideline | 100% | 2024 World Air Quality Report |
| Annual average PM2.5 (2023) | 12.4 μg/m³ | 2024 World Air Quality Report |
| Number of monitoring stations | Over 20 | NEA FAQs |
| Haze season months | June to October typically | NEA FAQs |
How does Singapore rank in air quality globally?
Three major indices answer this question, and each gives a slightly different number. The NEA’s official PSI is a daily health-based index, while global rankings rely on annual PM2.5 averages.
What is Singapore’s global AQI ranking?
Four indices, four numbers. The pattern: Singapore consistently lands in the middle of the pack, better than most of Southeast Asia but far from the cleanest air in the world.
| Index | Singapore’s Rank | Metric | Source |
|---|---|---|---|
| IQAir 2023 World Air Quality Report | 45th out of 131 countries | Annual PM2.5 (12.4 μg/m³) | 2024 World Air Quality Report |
| IQAir 2025 ranking (preliminary) | 84th out of 143 countries | PM2.5 exposure | IQAir Singapore air quality page |
| Yale EPI 2024 Air Quality | 50th (tied with Greece) | Composite score (53.7) | Yale Environmental Performance Index 2024 |
| NEA PSI (daily health index) | Not a ranking | 24-hour PSI bands | NEA FAQs |
The implication: Singapore’s global rank depends heavily on which index you use. The IQAir country ranking (based on PM2.5) tells a story of moderate pollution, but the PSI—used for daily health decisions—often shows “Good” or “Moderate” readings. The catch: episodic haze can push the PSI into unhealthy territory quickly, even if the annual average looks fine.
How does Singapore compare to other Southeast Asian countries?
Singapore’s air quality is better than most neighbours. According to IQAir’s 2024 report, Indonesia, Vietnam, and Thailand all have higher annual PM2.5 averages. But Singapore’s population is fully exposed to PM2.5 above the WHO guideline—meaning no one gets a break from fine particulate matter.
The pattern: regional proximity to biomass burning sources gives Singapore a baseline pollution level that, while moderate, still exceeds WHO safety thresholds.
Singapore can rank 45th globally on annual PM2.5 while still experiencing days where the PSI hits unhealthy levels. The annual average masks the haze spikes.
How clean is the air in Singapore?
On an average day, the air quality is “Moderate” by PSI standards. But “moderate” doesn’t mean zero risk—especially for sensitive groups.
What are the current AQI levels in Singapore?
Real-time data from the Central Singapore monitoring station shows an AQI of 63 (Moderate) as of the latest reading (PSI.SG). The 24-hour PSI ranges between 55 and 58, solidly in the Moderate band.
NEA maintains over 20 monitoring stations across the island, feeding data to haze.gov.sg and third-party apps.
What is the PSI in Singapore today?
The 24-hour PSI scale is straightforward: 0–50 Good, 51–100 Moderate, 101–200 Unhealthy, 201–300 Very Unhealthy, 301+ Hazardous (NEA FAQs). At 55–58, Singapore is currently in the Moderate zone.
Why this matters: even Moderate readings carry health advisories for prolonged outdoor exertion—especially for children, elderly, and those with respiratory conditions.
Is it safe to be outside?
The Ministry of Health advises that healthy persons can continue normal activities when PSI is below 100, but should reduce prolonged or strenuous outdoor exertion if PSI climbs above 100 (Ministry of Health Singapore). At the current PSI of 55–58, the risk is low for most people, but sensitive groups should monitor symptoms.
If the PSI crosses 100—which happens during haze episodes—the health advice shifts from “monitor” to “reduce exposure.” The NEA’s 1-hour PM2.5 bands (Normal, Elevated, High, Very High) are a faster indicator of sudden changes.
What are the top 5 countries with the worst air pollution?
To understand where Singapore sits, it helps to see the extremes. The 2024 IQAir report lists the most polluted countries by annual PM2.5 concentration.
Which countries rank highest in pollution?
Five countries, one pattern: industrial emissions, biomass burning, and geographic factors create a toxic baseline.
| Rank | Country | Annual PM2.5 (μg/m³) |
|---|---|---|
| 1 | Bangladesh | 79.9 |
| 2 | Pakistan | 73.7 |
| 3 | India | 54.4 |
| 4 | Tajikistan | 49.0 |
| 5 | Burkina Faso | 46.6 |
Source: 2024 World Air Quality Report
The implication: Singapore’s 12.4 μg/m³ is roughly 6.5 times cleaner than Bangladesh’s air. But that doesn’t mean it’s safe—WHO guidelines recommend annual PM2.5 below 5 μg/m³.
Where does Singapore fit in the global worst list?
Singapore is not in the top 20 worst. Its rank of 45th (IQAir 2023) places it in the middle third globally. That’s a better position than many developing nations, but still far from the benchmark of clean air.
What country has the best air quality?
At the other end of the spectrum, a handful of countries consistently report PM2.5 levels below 5 μg/m³.
Which countries report the cleanest air?
New Zealand, Australia, and several Nordic countries top the list. The table below shows the five best-performing countries from the 2024 IQAir report.
| Rank | Country | Annual PM2.5 (μg/m³) |
|---|---|---|
| 1 | New Zealand | 2.9 |
| 2 | Australia | 3.4 |
| 3 | Estonia | 4.4 |
| 4 | Finland | 4.5 |
| 5 | Canada | 5.0 |
Source: 2024 World Air Quality Report
The pattern: Singapore’s PM2.5 (12.4 μg/m³) is roughly 4 times higher than New Zealand’s. The gap is mostly driven by Singapore’s proximity to biomass burning sources and dense urban emissions.
How does Singapore compare to the best?
Singapore’s air is not in the same league as the cleanest countries. But compared to its geographic neighbours, it performs well. The trade-off: Singapore’s location in the ASEAN haze belt means it will always face seasonal pollution spikes that the Nordic countries never see.
Singapore’s moderate annual average hides a seasonal reality: for 2–3 months each year, transboundary haze can push the PSI to unhealthy levels, making the air worse than the global rank suggests.
Why is Singapore so hazy at night?
Anyone who has walked through Singapore on a hazy evening has noticed that the air often feels worse after sunset. There’s a meteorological reason for that.
What causes haze in Singapore?
The primary cause is transboundary haze—smoke from forest and peat fires in Indonesia (especially Sumatra and Kalimantan) that drifts across the region. The NEA describes it as a recurring annual phenomenon during the dry season (June–October) (NEA FAQs).
Local sources—vehicle emissions, industrial activity, and construction dust—also contribute, but the extreme spikes are almost always from transboundary fires.
Does the haze worsen after dark?
Yes, and it’s a physical phenomenon called temperature inversion. During the night, the ground cools faster than the air above, creating a stable layer that traps pollutants near the surface. This is why haze often seems thicker in the evening and early morning. The Healthway Medical advisory recommends keeping windows closed and using air purifiers during haze episodes (Ministry of Health Singapore).
The implication: the haze you see at night isn’t necessarily worse pollution—it’s the same particles being held closer to the ground by the inversion layer.
Even moderate PSI readings during the day can become more concentrated at night. Residents with respiratory conditions should check the 1-hour PM2.5 bands before evening outdoor activities.
Timeline of Singapore’s air quality events
- 2019: Singapore’s AQI ranged between Good and Moderate for the entire year, according to the NEA’s historical PSI dataset (data.gov.sg / NEA historical PSI dataset).
- 2023: IQAir ranks Singapore 45th globally for air quality, with an annual PM2.5 average of 12.4 μg/m³.
- October 2023: A severe haze episode from Indonesian fires pushes the 24-hour PSI to unhealthy levels (above 100) for several days.
The pattern: each year, the haze season brings a temporary but sharp deterioration. The long-term trend is stable, but not improving.
What’s confirmed, what’s unclear
Confirmed facts
- Singapore uses PSI as its official air quality index, based on a 24-hour rolling average of six pollutants (NEA FAQs).
- Transboundary haze from Indonesia is a recurring annual issue (NEA FAQs).
- Air quality is generally moderate but varies by season, with PSI readings typically in the 50–60 range outside haze periods (PSI.SG).
What’s unclear
- The exact ranking for 2024 from IQAir’s next report is not yet published; the 2025 preliminary ranking of 84th out of 143 may change.
- Long-term health impact of sustained moderate PM2.5 levels (12–15 μg/m³) on Singapore’s population is not yet fully studied.
- Exact contribution of local emissions versus transboundary sources to baseline PM2.5 levels remains uncertain.
Quotes and perspectives
“The 24-hour PSI is intended to provide easily understandable information about daily air quality.”
— National Environment Agency (NEA) spokesperson, via NEA FAQs
“Singapore’s air quality index is PSI rather than AQI, which is an alternative index used in other countries.”
— IQAir report author, via IQAir Singapore air quality page
“Healthy persons should avoid prolonged or strenuous outdoor physical exertion when PSI is very unhealthy or hazardous.”
— Ministry of Health Singapore, haze advisory
The data tells a clear story: Singapore’s air quality is moderate on average, but the haze season makes it a game of two halves. For residents and visitors, the implication is straightforward: check the PSI or 1-hour PM2.5 bands before planning outdoor activities, especially between June and October. For policymakers, the challenge is to reduce transboundary haze through regional cooperation—because no amount of local regulation can stop the smoke from crossing borders.
Related reading: Gold Price Per Gram Singapore: 24K, 22K & 916 Rates · CPF Full Retirement Sum 2025-2026: Amount, Withdrawal & Payout
Frequently asked questions
What is the difference between PSI and AQI?
PSI (Pollutant Standards Index) is Singapore’s official index, based on a 24-hour rolling average of six pollutants. AQI (Air Quality Index) is used in many other countries and often focuses on hourly PM2.5 readings. The NEA uses PSI for daily health advisories, while global rankings like IQAir use AQI-style PM2.5 averages.
Which government agency monitors air quality in Singapore?
The National Environment Agency (NEA) is the primary agency. It operates over 20 monitoring stations and publishes real-time data on haze.gov.sg and data.gov.sg. For related Singapore topics, see Gold Price Per Gram Singapore: 24K, 22K & 916 Rates.
How often does Singapore experience haze?
Haze is a recurring annual phenomenon, typically during the southwest monsoon season from June to October. The severity depends on the intensity of forest fires in Indonesia.
What should I do when the PSI is unhealthy?
The Ministry of Health advises reducing prolonged or strenuous outdoor exertion. Keep windows closed, use air purifiers, and monitor the NEA’s 1-hour PM2.5 bands for real-time updates.
Can I check real-time air quality on my phone?
Yes. The NEA’s haze.gov.sg site, third-party apps like IQAir and AccuWeather, and the PSI.SG website all provide real-time data.
Does the air quality inside buildings differ from outside?
Yes. Indoor air quality can be better if windows are closed and air purifiers are used. However, without filtration, indoor PM2.5 levels often mirror outdoor levels, especially during haze episodes.
What are the health risks of long-term exposure to moderate pollution?
Long-term exposure to PM2.5 above 5 μg/m³ (WHO guideline) is linked to increased risk of respiratory and cardiovascular diseases. At Singapore’s annual average of 12.4 μg/m³, the risk is elevated but not as high as in heavily polluted cities.
More related posts
 Tha Siam Authentic Thai Kitchen Parklane: Menu, Review & Di he
 Crystal Palace vs Brighton: TV Channel, Rivalry & Head-to-Head
 What to Do in Chinatown Singapore: Best Attractions & Itinerary
 3000 Yen to SGD – Current Rate, Trends and Conversion Tips
 Hougang vs Young Lions: Head-to-Head, Predictions & Stream
 Best Free Movie Streaming Sites: Watch Movies Online Free
 Is Stomach Flu Contagious? Timeline & When to Isolate
 China Open Badminton 2025: Results, Schedule, Draw